KPI Definitions
Agree how each measure is calculated so every team uses the same figure.
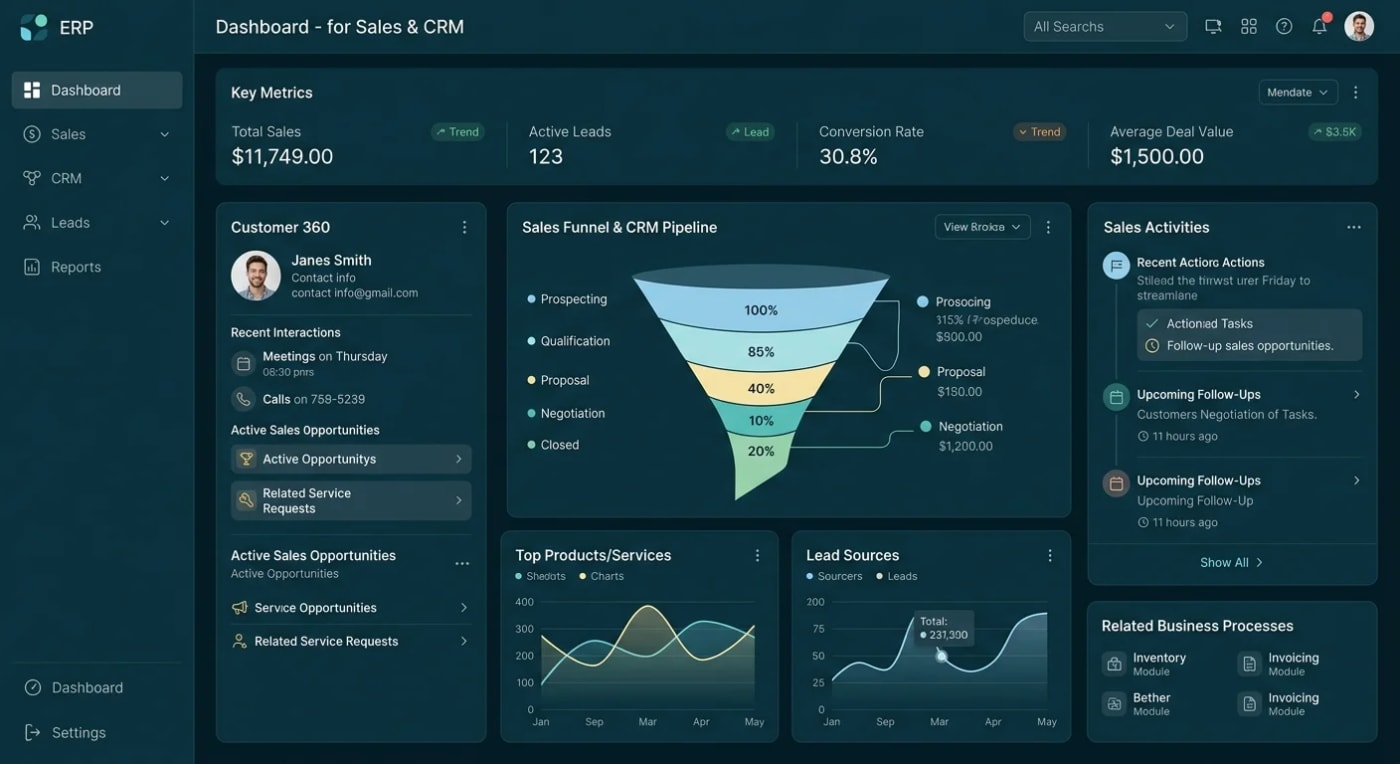
See how the business is performing without waiting for a report. Phentech builds internal dashboards that bring live KPIs from sales, operations, finance and people into one trusted view for managers and teams.
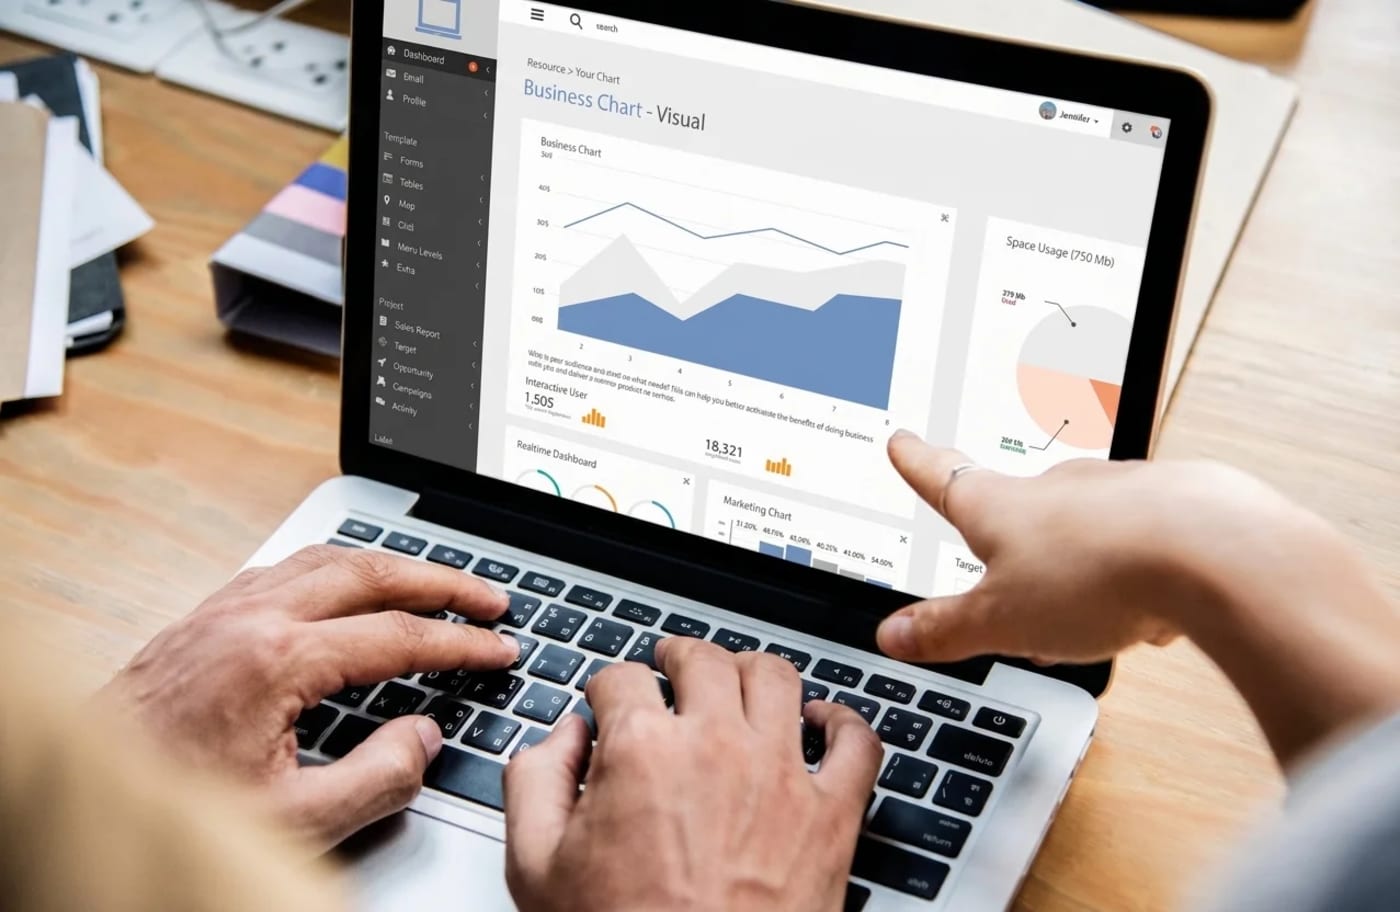
Every week someone exports data from several systems, pastes it into a spreadsheet, fixes the formulas and sends it round. By the time managers read it, the numbers are already out of date.
An internal dashboard connects directly to your systems, calculates KPIs the same way every time and shows each manager the measures they are responsible for, as they change.
When reporting depends on manual work, decisions wait for the numbers and the numbers are often questioned.
Hours spent building reports from exports, copy and paste, and fragile spreadsheets.
Different figures for the same KPI because each team calculates it its own way.
Problems spotted weeks late after the monthly report finally lands.
No way to drill into the detail so every question becomes another data request.
We agree what each KPI means, connect the right data sources, then design dashboards around the decisions managers make.
Agree how each measure is calculated so every team uses the same figure.
Pull data automatically from CRM, ERP, accounts and operational systems.
Directors, managers and team leads each see the measures they own.
Click from a headline figure to the records behind it.
Get notified when a KPI moves outside its target range.
The result is less time preparing reports and more time acting on them.
Dashboards built for internal teams, connected to the systems that hold your data.
Revenue, margin, pipeline, output and headcount on a single screen.
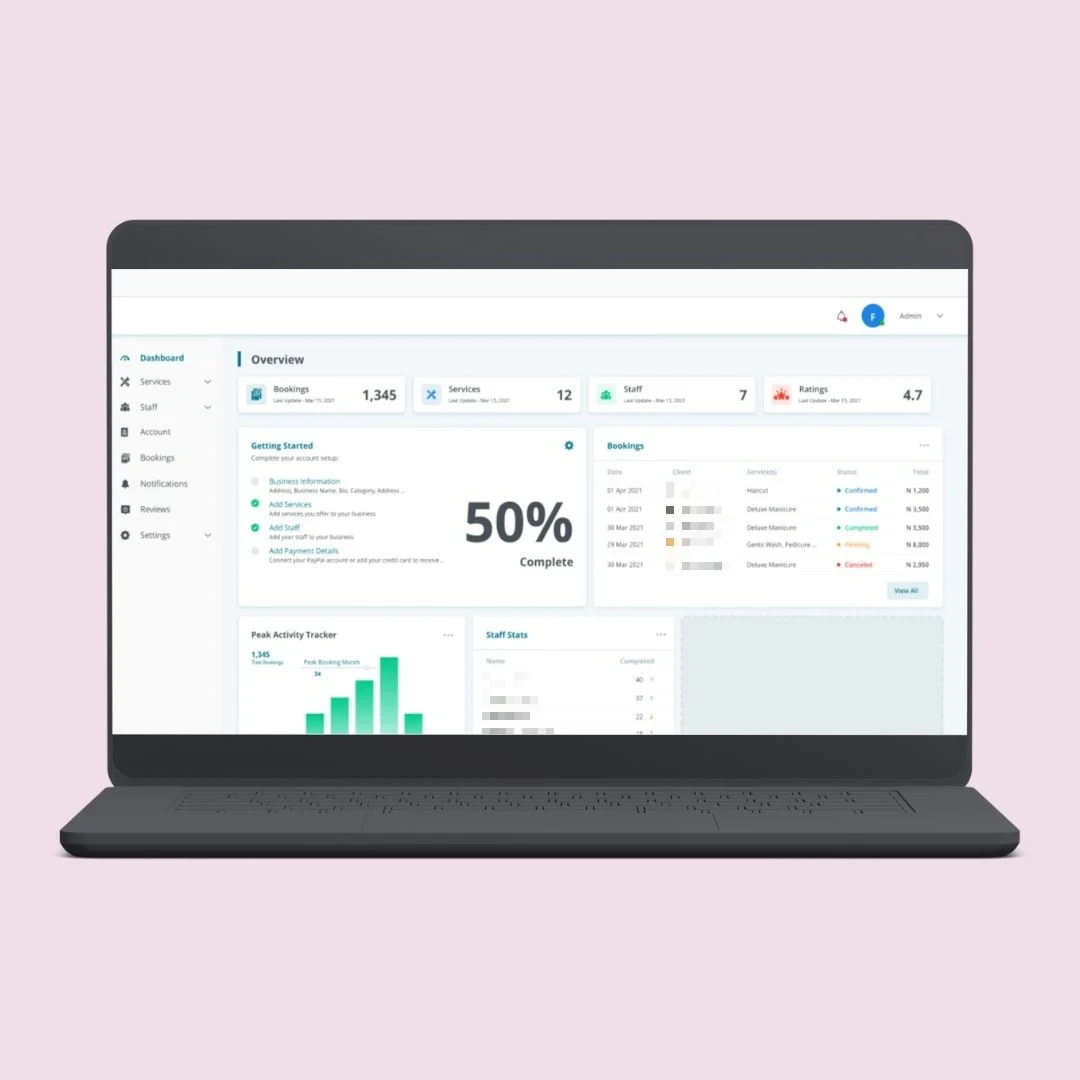
Focused views for sales, operations, finance, HR and support.
Actuals compared with budget, target and last period.
Board and management reports generated and emailed automatically.
Built in Power BI or as a custom web dashboard, depending on your needs.
Each department gets the measures that matter to it, from the same reliable data.
Company-wide KPIs, trends and targets.
Output, backlog, utilisation and service levels.
Revenue, costs, cash and margin by area.
Manual reports show where you were. Live dashboards show where you are.
When someone spends hours each week building reports, or managers argue about whose numbers are right, it is time for dashboards built on agreed data.Book A Call
We start with the decisions you need to make, then work back to the data.
Agree the measures, targets and owners with each team.
Link your systems and build a clean, reliable data model.
Build clear visuals and check every figure against your source data.
Roll out to teams and add new measures as needs grow.
Dashboards draw on the systems that already hold your numbers.
We combine data engineering with an understanding of how managers use numbers to run a business.
Discuss Your ProjectOWASP-based testing and a written report, not a promise.
Reliable pipelines from every source system.
A clear scope and price before any work starts.
See how we have given business owners and managers a clearer view of their operations.
Quick answers about internal dashboards.
Let's talk about your reporting.
Book a Free ConsultationPower BI suits teams already on Microsoft 365 who want flexible analysis. A custom dashboard suits embedded, highly specific or high-volume needs. We recommend based on your situation.
That depends on your sources. Some data can refresh in near real time, while other sources update on a schedule, such as hourly or overnight.
Yes. Bringing data from CRM, ERP, accounts and operational tools together is a core part of the work, including matching records between them.
Yes. We apply role-based and row-level security so each person sees only the teams, regions or figures they are responsible for.
Yes. Full source code and IP ownership, with the system deployed to your own cloud account, so there is no vendor lock-in. We sign an NDA on request.
Our in-house engineers at Phentech. No subcontracting. Every project is scoped and architected by a senior engineer before it is quoted.
The most useful dashboards are often the simplest. We recommend starting with five to ten KPIs that drive real decisions, rather than every number your systems can produce.
Tell us which reports take the most effort today and we'll show you how they could update themselves. Send us your workflow first. Every project is scoped before it's quoted.