KPI Definitions
Agree formulas, targets and owners for each metric before building.
See how the business is performing without waiting for a spreadsheet. Phentech builds dashboards and reports that pull live data from your systems, so every manager tracks the same KPIs from the same numbers.
In many companies, reporting means exporting data from several systems, pasting it into spreadsheets and fixing formulas before anyone sees a number. By the time the report is shared, the month has moved on.
A reporting layer connects to your operational data, calculates KPIs the same way every time and shows each team the figures they are responsible for, updated automatically.
When reports are built by hand, people argue about the numbers instead of the decisions.
Spreadsheets built every week from exports that take hours to combine.
Different versions of the truth because each team calculates KPIs its own way.
Reports that are already old by the time they reach management.
No way to drill down from a headline figure to the records behind it.
We agree what each KPI means and where its data comes from, then build dashboards that calculate it consistently.
Agree formulas, targets and owners for each metric before building.
Bring sales, stock, finance and HR data into one reporting store.
Directors, managers and teams each see the views that matter to them.
Data updated automatically, from near real time to daily.
Scheduled PDF and Excel reports emailed to the right people.
The result is one set of numbers that every team and every meeting uses.
Reporting tools that turn the data already in your systems into a clear view of the business.
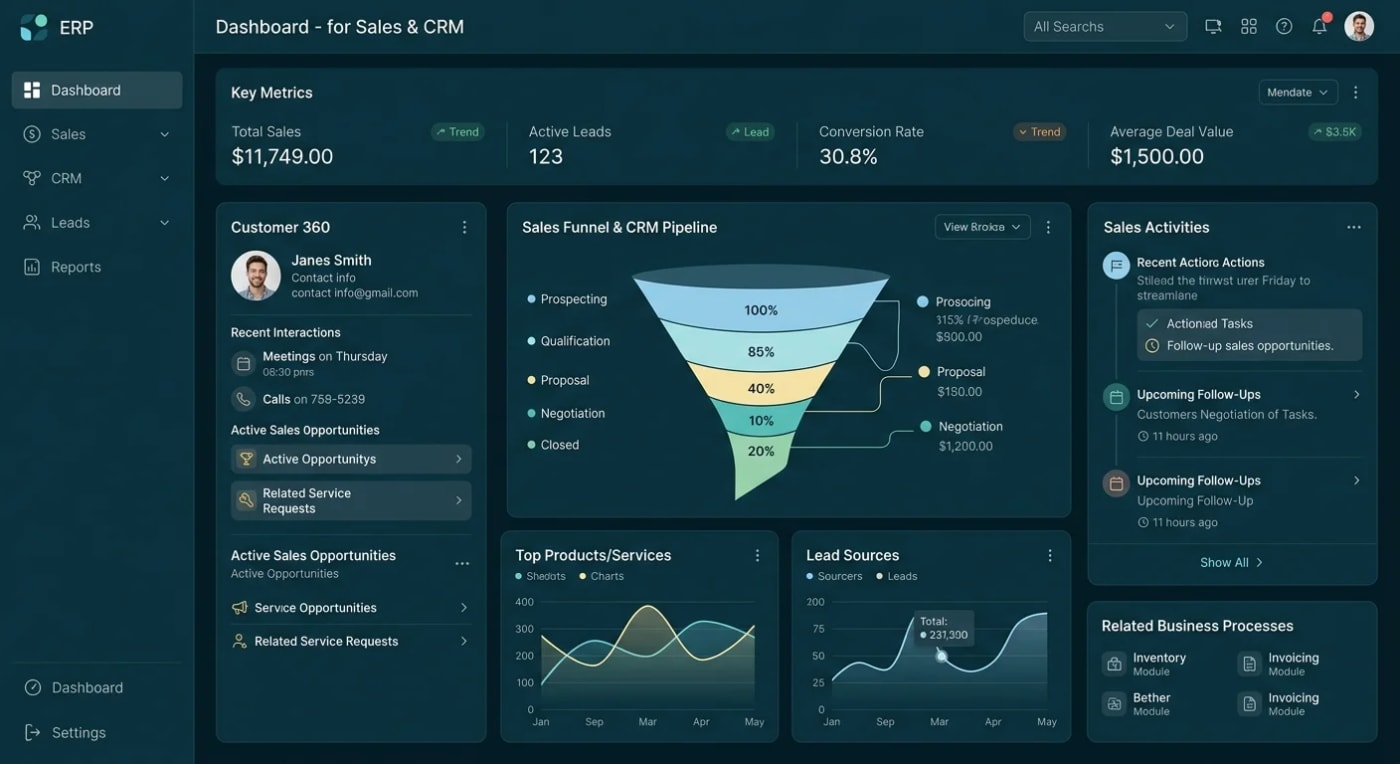
Revenue, margin, cash, orders and headcount on one management screen.
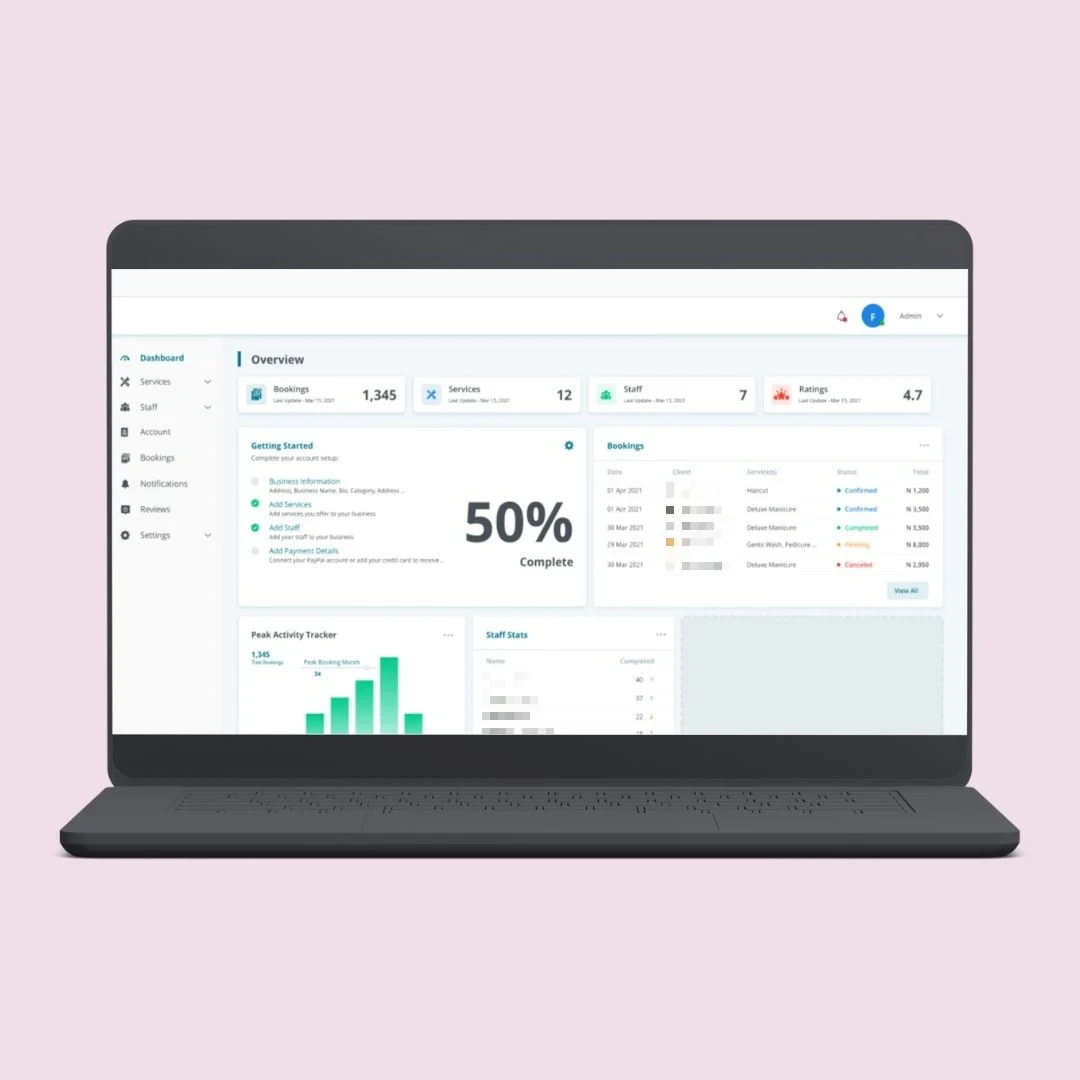
Sales, operations, inventory, finance and HR views with their own targets.
Click from a total to the branch, team, customer or transaction behind it.
Daily, weekly and monthly reports by email, PDF or Excel.
A central reporting database fed automatically from your systems.
From the boardroom to the shop floor, each person sees the figures they act on.
Company performance against targets in one view.
Revenue, costs, margins and cash flow reporting.
Orders, stock, delivery and team productivity metrics.
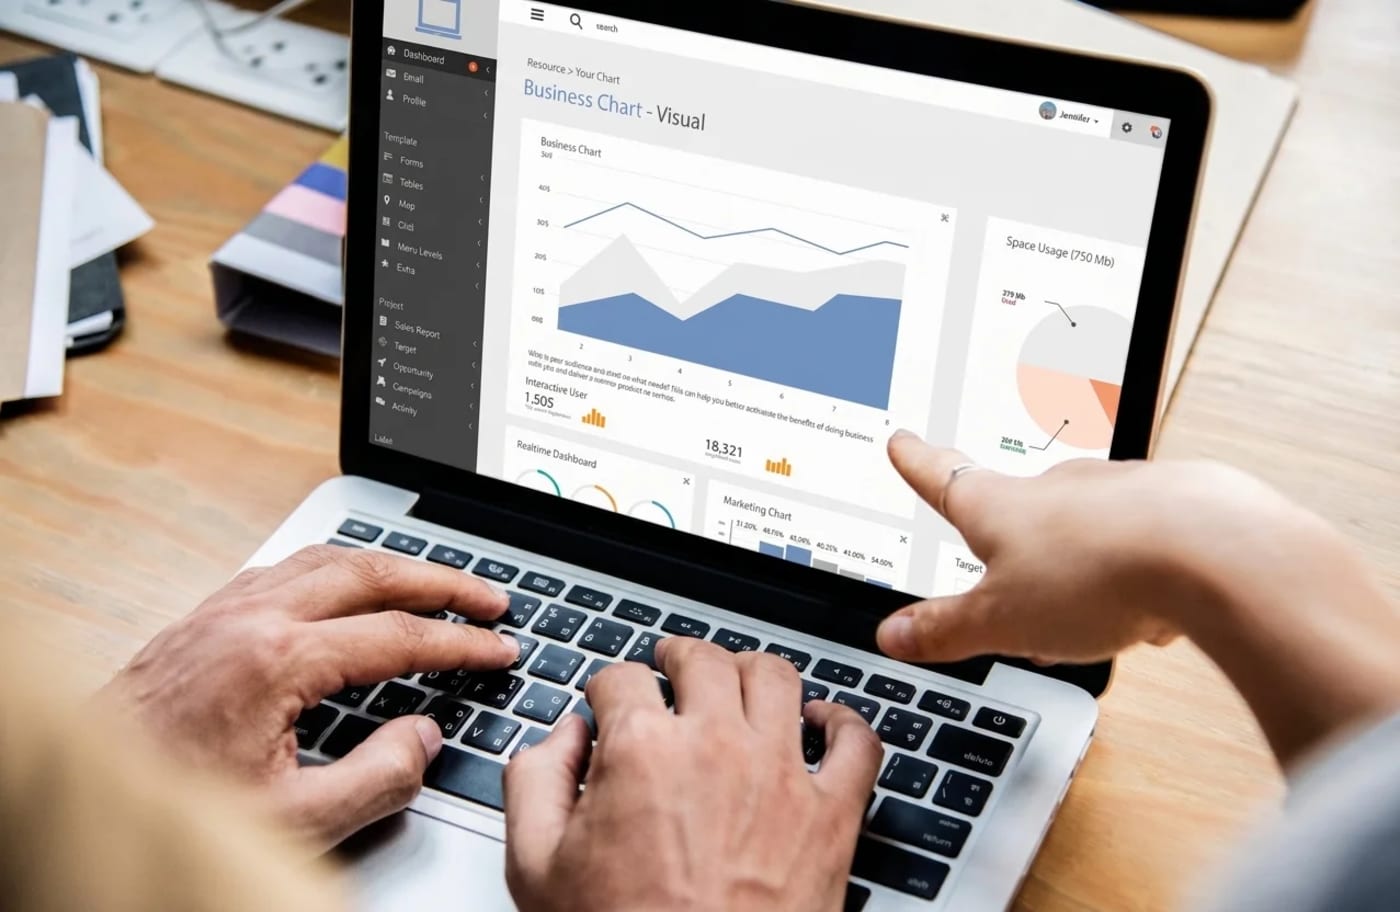
Manual reports describe the past. Live dashboards show what is happening while there is still time to respond.
When someone spends hours each week building the same report, or meetings start with debates about whose numbers are right, it is time to automate your reporting.Book A Call
A structured approach that delivers useful dashboards early and expands from there.
Review the reports you produce today and the data behind them.
Agree metrics, targets, owners and refresh frequency.
Build data pipelines and a reporting model from your systems.
Release dashboards, gather feedback and add new views.
We bring together data from the systems and tools your business already runs on.
We build the data foundations as well as the dashboards, so your reports stay accurate as the business changes.
Discuss Your ProjectWe learn what each number means before we chart it.
OWASP-based testing with a written report before go-live.
We map your workflow first, then give a clear price.
See how we have helped businesses track performance across their operations.
Quick answers about reporting and dashboards.
Let's talk about your reporting.
Book a Free ConsultationYes. We connect to your databases, business applications and spreadsheets, and combine the data into a single reporting model.
Both. We use tools such as Power BI where they fit, or build dashboards directly into your own system when you need tighter control or embedded reporting.
It depends on your needs and source systems. Some dashboards refresh every few minutes, while others update overnight.
Yes. Access can be limited by role, department, branch or region, so each person sees only the figures they are allowed to.
Yes. Full source code and IP ownership, deployed to your own cloud account, so there is no vendor lock-in. We sign an NDA on request.
No. Fully custom, built on ASP.NET Core and SQL Server around your workflow. No templates and no off-the-shelf plugins.
Good dashboards start with a short list of metrics. Agreeing a handful of KPIs that drive real decisions is more useful than charting everything the data allows.
Let's review your current reporting and design dashboards that update themselves. Send us your workflow first. Every project is scoped before it's quoted.