Service-Level Goals
Agree what good looks like for uptime and response times.
Know how your applications are behaving before your users tell you. Phentech sets up monitoring, logging and alerts, then finds and fixes the bottlenecks that make software slow.
Many teams learn about outages from customer complaints. Logs are scattered across servers, alerts are either missing or so noisy that people ignore them, and slow pages are hard to trace back to a cause.
Good observability brings metrics, logs and traces together in one place. It shows what is happening, why it is happening and where to focus, so problems are found early and fixed quickly.
Without visibility, small issues grow into outages and slow software drives users away.
Outages found by customers instead of by alerts.
Slow pages and APIs with no clear idea where the time goes.
Logs scattered everywhere making investigations slow and frustrating.
Noisy alerts that the team has learned to ignore.
We focus on the signals that matter to your users and your business, not on collecting every possible metric.
Agree what good looks like for uptime and response times.
Key health indicators visible at a glance.
Structured logs searchable in one place.
Follow each request across services to find delays.
Alerts tied to user impact, routed to the right people.
The result is fewer surprises, faster fixes and software that stays responsive as you grow.
Practical monitoring and performance work for web apps, APIs and cloud platforms.
Response times, error rates and throughput tracked for every service.
Logs from servers, containers and apps collected into one searchable system.
Automated checks on key pages and API endpoints from multiple locations.
Simulated traffic to find limits before real users hit them.
Query, caching and code improvements based on real measurements.
We cover the layers that affect how your software performs for users.
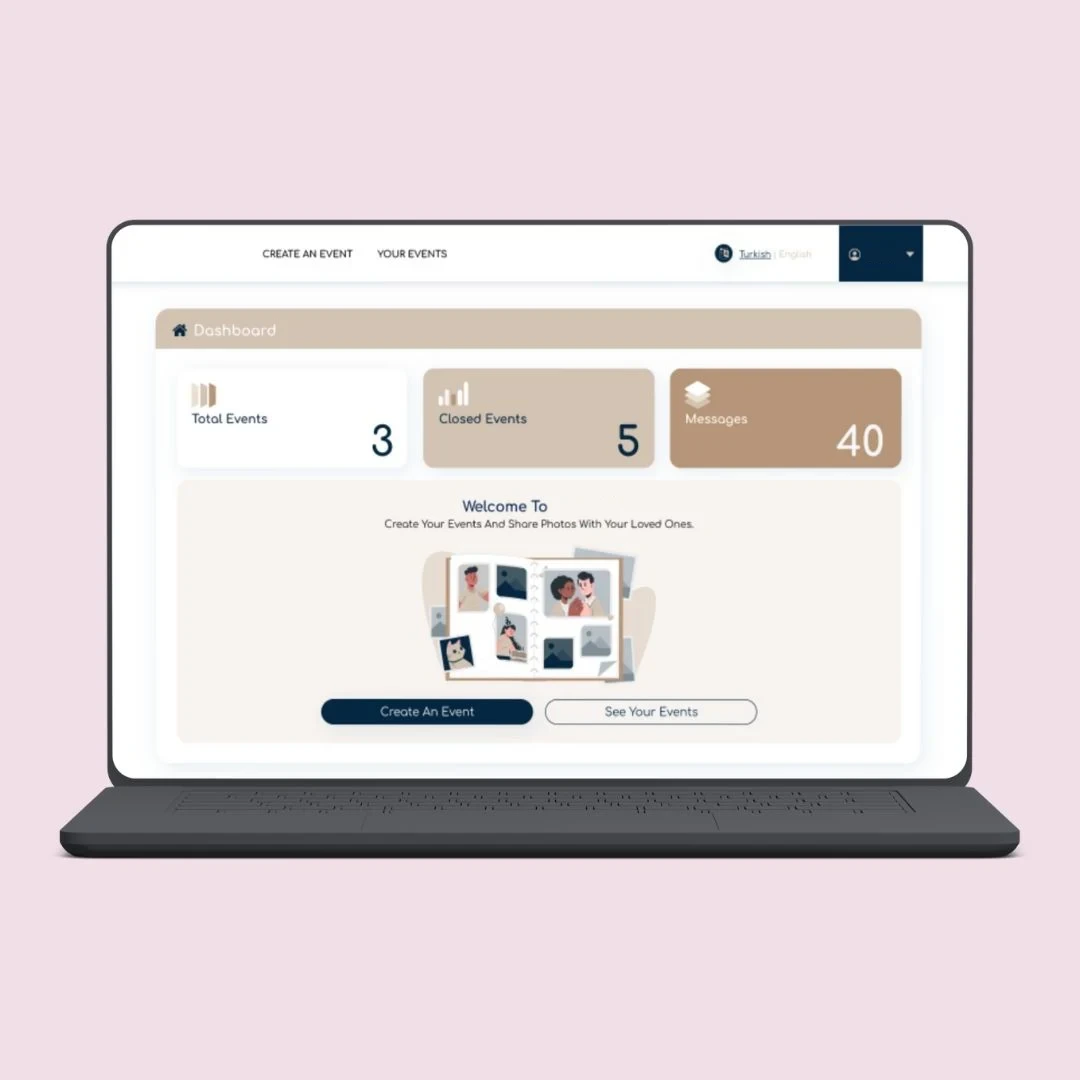
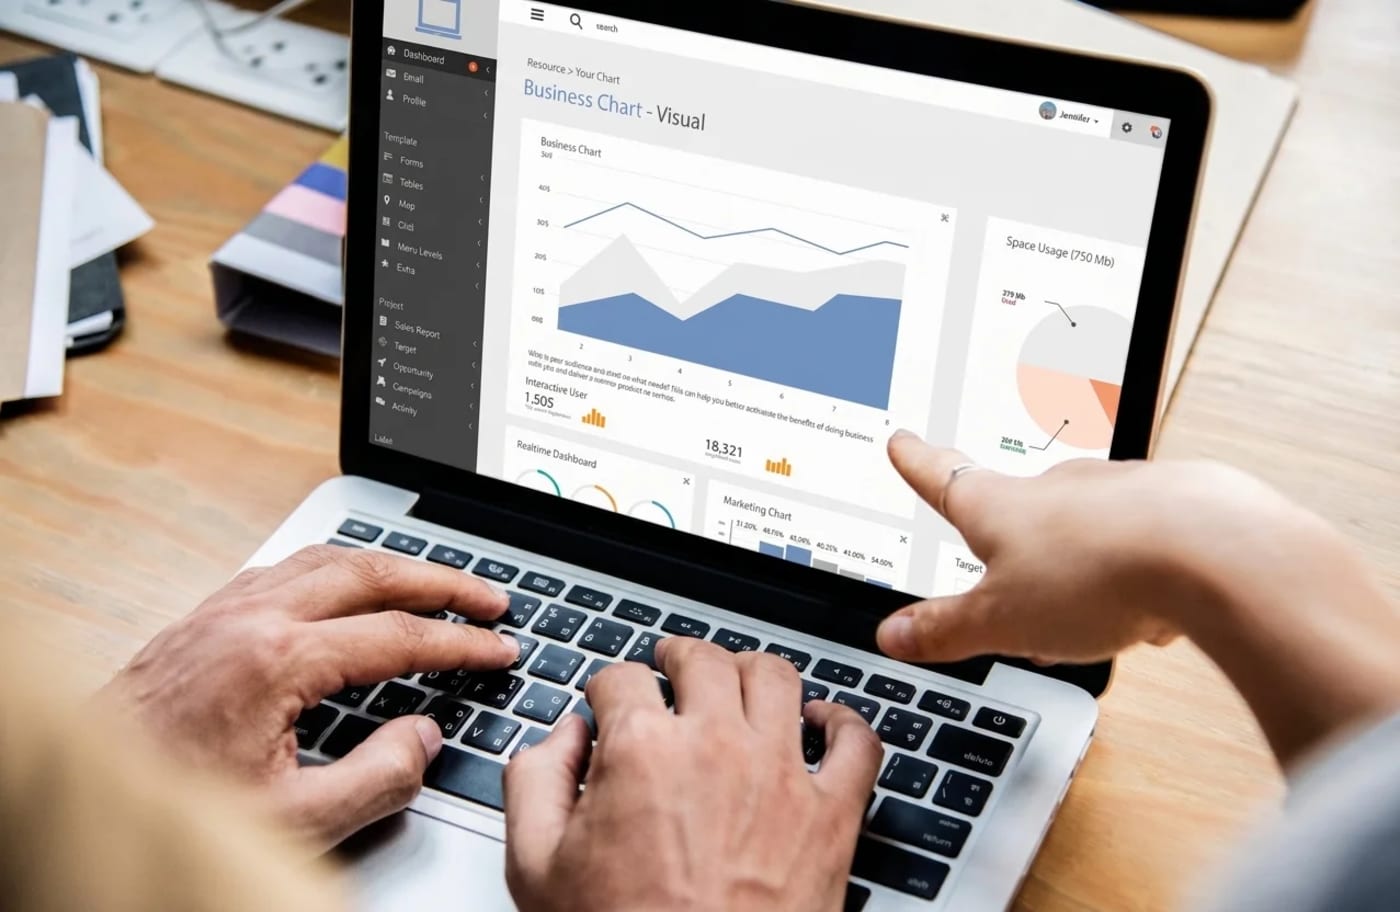
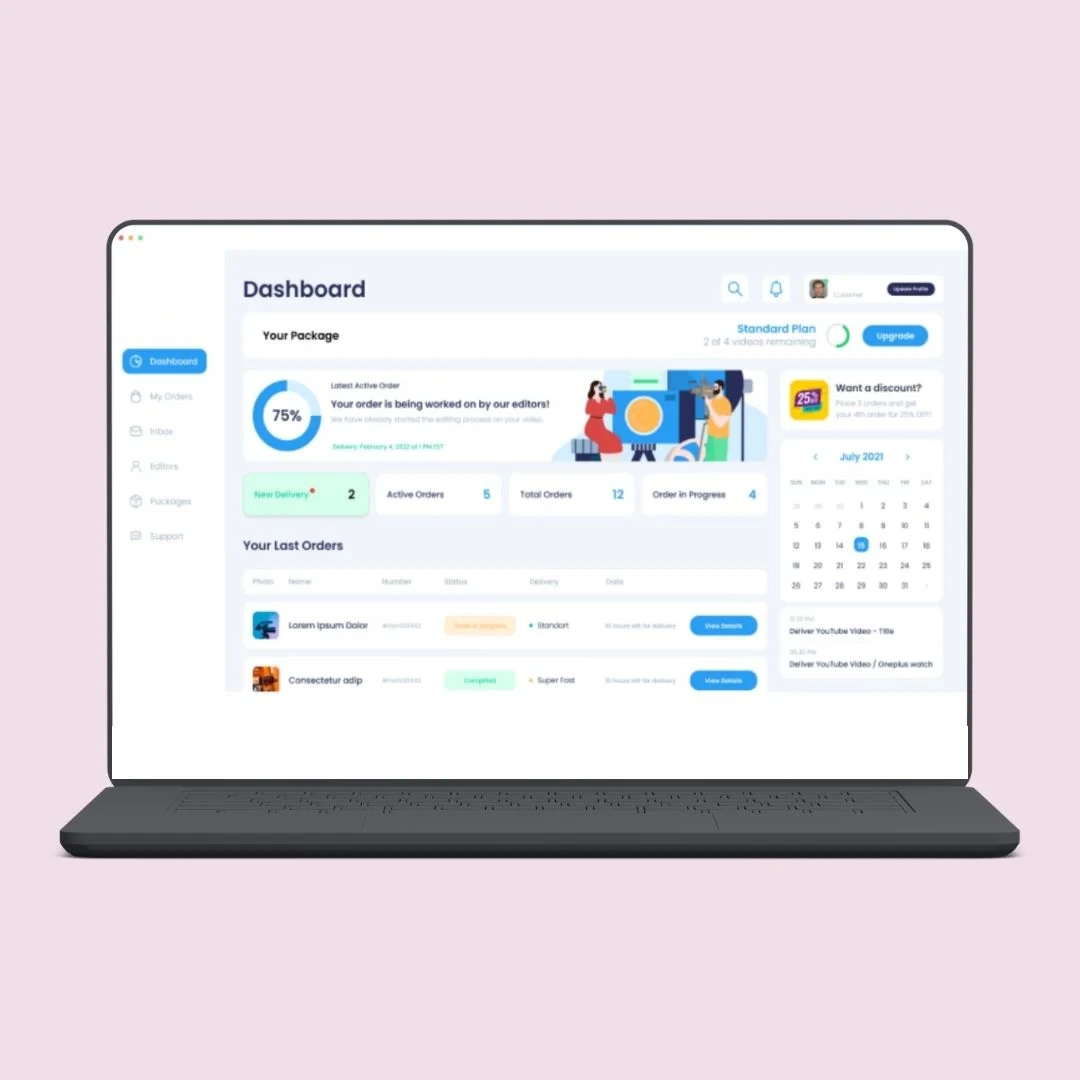
Health, usage and errors on one screen.
Servers, containers, databases and queues.
Page load times and real user performance.
Reactive support waits for complaints. Proactive monitoring finds issues first.
When outages are discovered by customers, performance complaints are hard to investigate or your traffic is growing, proper monitoring gives your team the visibility it needs.Book A Call
A focused process that delivers useful monitoring quickly and improves it over time.
Review current tools, incidents and performance.
Add metrics, logs and traces to your services.
Build dashboards and tune alerts to real impact.
Fix bottlenecks and review trends regularly.
We use the monitoring built into Azure and AWS first, and add only what your budget and stack need.
We combine monitoring setup with the engineering skills to fix what it uncovers.
Discuss Your ProjectEverything runs in your own Azure or AWS account. No vendor lock-in.
Access, secrets and configuration reviewed, with security testing available.
Documentation you can hand to another team.
See some of the applications we build and keep running smoothly for their users.
Quick answers about monitoring and performance.
Let's talk about your application.
Book a Free ConsultationNot necessarily. Open-source tools and the monitoring built into AWS and Azure cover most needs. We recommend paid tools only when they add clear value.
When set up properly the overhead is very small. We use sampling and sensible log levels to keep the impact low.
Yes. Our engineers tune queries, add caching, adjust infrastructure and improve code based on what the monitoring shows.
Alerts can go to your team, to us under a support plan, or both. We agree the routing and escalation rules with you.
Yes. We deploy to your own Azure or AWS account, so you keep full control and there is no vendor lock-in.
Our in-house engineers at Phentech. No subcontracting, and an NDA signed on request.
Average response times can hide real problems. Tracking percentiles such as p95 and p99 shows how the slowest requests perform, which is often what frustrated users are actually experiencing.
Let's set up monitoring that catches problems early and keeps your applications fast. Tell us what you run today and where. We scope the work before we quote.